![]()
![]()
![]()
![]()
![]()
|
|
Estate agents (realtors) have information like this:
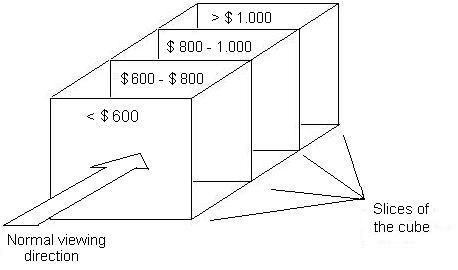
"Ap3" is "Apartment 3" and "Hs5" is house number 5 in her catalogue. That is a 2 dimensional view of the information, the dimensions being "Size in square feet" and "region". A client can look at this table and see that there is an apartment in the south of town of the size he is looking for, "900-1,100 square feet". The price is a third aspect (or dimension). So really you need a cube to show the information:
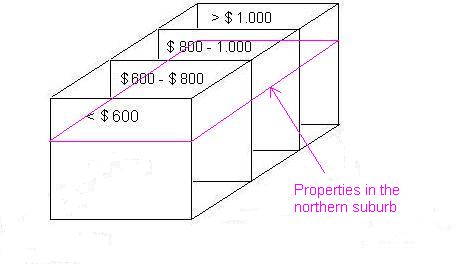
The realtor could have different sheets of paper, one for each price category. Or she could divide the information up differently and have a sheet per suburb. The northern suburb would be the pink slice:
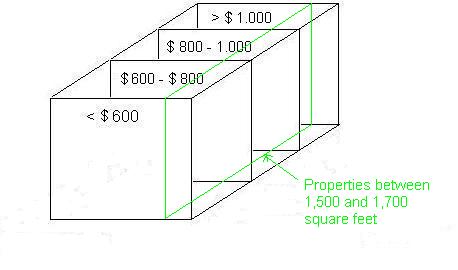
Alternatively, a client might want to see all the properties between 1500 and 1700 square feet, regardless of their position or price. So the realtor would have to produce the green slice of her data:
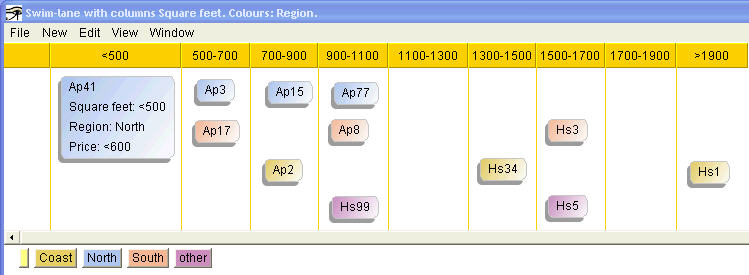
The raw data could be visualised in i2Brain like this:
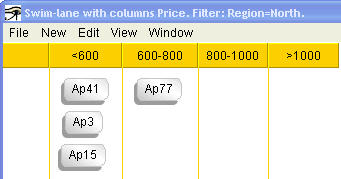
The left-most item, Ap41, has been "folded open" so you can see which data is stored there. As soon as the raw data has been entered, i2Brain can show the information in almost any combination the user may require. For instance, a client might be interested in a property in the north and would like an overview of the prices:
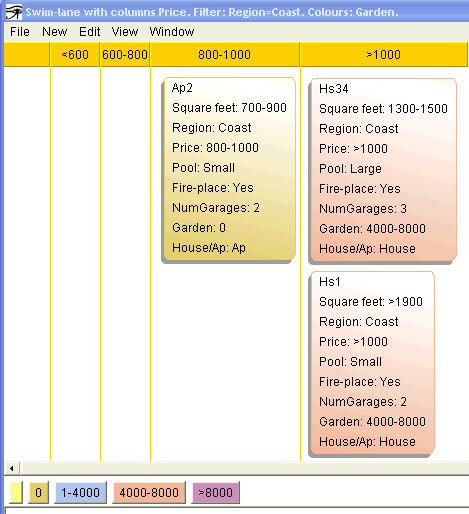
Generally, such information has more than these 3 aspects. Other important details might be the size of the garden (if there is one), whether the property has an open fire-place, the number of garages, whether it has a swimming pool etc. In this example, it would also make sense to have an aspect "House or apartment". Once this information has been entered for all the properties, it is very easy to see what is available according to different criteria: maybe a client is looking for something on the coast with a reasonable garden and wants to know the price categories. In the following screenshot a "filter" ensures that only properties on the coast are shown. The colors indicate the size of the garden and the columns are the price categories:
Each item of information has 8 aspects (we don't count the name), so we are really dealing with a very complex 8-dimensional "hyper-cube" of information. Displaying that is a problem! i2Brain helps you to get an overview of (or even comprehend) such things by filtering and using colors. You can turn the hyper-cube to view your data from any angle, and you can take slices (or hyper-slices?) using filters and colors. The point is that you can save time by using i2Brain because you don't need to rifle through lists comparing various aspects of your information.
This example with properties displays more or less static data. Further uses are shown in the other examples, including very dynamic data in a brainstorming meeting.
|