This is a very first version of something I need and fancied playing around with.
The current version just shows a BarChart in 3D, allowing the user to rotate the chart around all axes by dragging the mouse over the graphic.
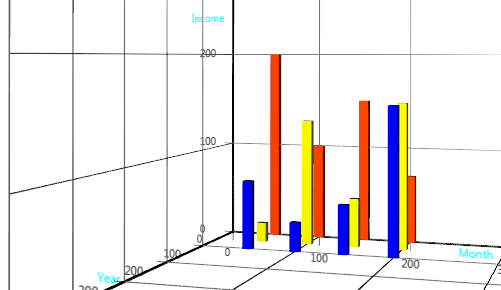
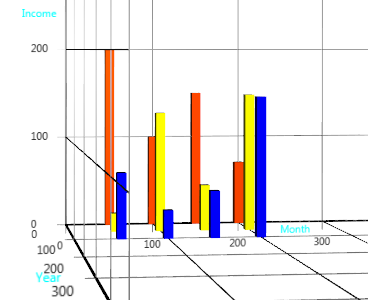
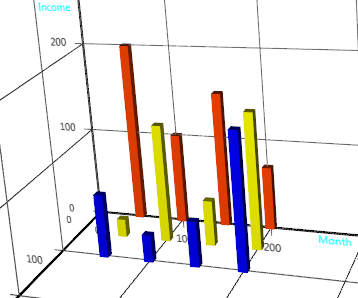
You supply the data to be shown using the same API as JavaFX 8 BarChart.
My purpose in posting this code is to hear from anyone who
Send your feedback to info (at) i2Brain (dot) com
List<XYChart.Series<Number, Number>> is allowed,
not List<XYChart.Series<String,
Number>>)
You can download the 5 zipped .java files here.
Here's the file which contains main and start. It gets the data from any old class, in
this case ChartDemoData, but yours could read from a
DB or whatever.
The main point is that its method getData() returns a List<Series<Number, Number>>.
This list is then passed into BarChart3D's createBarChart3DScene(data) and then BarChart3D
does all the work for you.
package application;

import java.util.List;

import com.i2brain.chart3d.BarChart3D;

import javafx.application.Application;
import javafx.scene.Scene;
import javafx.scene.chart.XYChart.Series;
import javafx.stage.Stage;

/**
 */
public class Chart3DDemoMain extends Application {

	@Override
	public void start(Stage primaryStage) {

		List<Series<Number, Number>> data = ChartDemoData.getData();

		Scene scene = new BarChart3D().createBarChart3DScene(data);

		primaryStage.setTitle("Chart3D Demo");
		primaryStage.setScene(scene);
		primaryStage.show();
	}

	public static void main(String[] args) {
		launch(args);
	}
}
As explained above, this is the class you replace. It has one method which should return your data in the List.
package application;

import java.util.ArrayList;
import java.util.List;

import javafx.scene.chart.XYChart;

/** A simple class whose only method fills a List with data.
 *  So the method could read a DB or whatever.
 *  It's separated from main to fulfil SRP.
 *
 * @author JohnDev
 *
 */
public class ChartDemoData {

	static List<XYChart.Series<Number, Number>> getData() {

		List<XYChart.Series<Number, Number>> dataList = new ArrayList<>();

		XYChart.Series<Number, Number> series1 = new XYChart.Series<>();
		series1.setName("2003");	// Z-Axis
		series1.getData().add(new XYChart.Data<>(1, 200));
		series1.getData().add(new XYChart.Data<>(2, 100));
		series1.getData().add(new XYChart.Data<>(3, 150));
		series1.getData().add(new XYChart.Data<>(4, 70));
		dataList.add(series1);

		XYChart.Series<Number, Number> series2 = new XYChart.Series<>();
		series2.setName("2004");	// Z-Axis
		series2.getData().add(new XYChart.Data<>(1, 20));
		series2.getData().add(new XYChart.Data<>(2, 130));
		series2.getData().add(new XYChart.Data<>(3, 50));
		series2.getData().add(new XYChart.Data<>(4, 150));
		dataList.add(series2);

		XYChart.Series<Number, Number> series3 = new XYChart.Series<>();
		series3.setName("2005");	// Z-Axis
		series3.getData().add(new XYChart.Data<>(1, 70));
		series3.getData().add(new XYChart.Data<>(2, 30));
		series3.getData().add(new XYChart.Data<>(3, 50));
		series3.getData().add(new XYChart.Data<>(4, 150));
		dataList.add(series3);

		return dataList;
	}

}
This is your gateway to BarChart3D. You simply call its single public method, passing in the data in a List. That's it.
Later versions will alow you to influence further aspects of the chart.
package com.i2brain.chart3d;

import java.util.Collection;
import java.util.List;

import javafx.geometry.Point3D;
import javafx.scene.Camera;
import javafx.scene.Group;
import javafx.scene.PerspectiveCamera;
import javafx.scene.Scene;
import javafx.scene.SceneAntialiasing;
import javafx.scene.chart.XYChart;
import javafx.scene.chart.XYChart.Data;
import javafx.scene.chart.XYChart.Series;
import javafx.scene.control.Tooltip;
import javafx.scene.input.MouseEvent;
import javafx.scene.paint.Color;
import javafx.scene.paint.PhongMaterial;
import javafx.scene.shape.Box;
import javafx.scene.transform.Rotate;
import application.ChartDemoData;

/** What the user calls in order to create a BarChart3D.
 *
 * @author JohnDev
 */
public class BarChart3D {

	// TODO make these into properties. Use API of ChartFX.
	private static final int xBarSeparation = 50;
	private static final int zBarSeparation = 50;
	private static final int barDepth = 10;
	private static final int barWidth = 10;

	private final double sceneWidth = 600;
	private final double sceneHeight = 600;
	private static double mouseXold = 0;
	private static double mouseYold = 0;
	private static final double rotateModifier = 10;

	private final Color[] barColors = { Color.ORANGERED, Color.YELLOW, Color.BLUE, Color.GREEN };	// TODO use CSS:

	/** Sets up a Scene, the Camera and Children for a BarChar3D.
	 *
	 * @param data	TODO Allow List<String, Number> to match ChartXY's API
	 * @return
	 */
	public Scene createBarChart3DScene(List<Series<Number,Number>> data) {
		Group group = new Group();
		Scene scene = new Scene(group, sceneWidth, sceneHeight, true, SceneAntialiasing.BALANCED);
		scene.setFill(Color.WHITE);
		Camera camera = createCamera();
		scene.setCamera(camera);

		group.getChildren().add(createChildren(data));

		scene.addEventHandler(MouseEvent.ANY, event -> {
			mouseHandler(group, event);
		});
		addMouseWheelControl(scene, group);
		return scene;
	}

	public Group createChildren(List<Series<Number,Number>> data) {
		final Group bars = createValueBars(data);
		// TODO pass the names of the Axes in as a parameter
		Group primitiveGroup = new Group(new Axes().createAxes("Month", "Income", "Year"), bars);
		return primitiveGroup;
	}

	private Group createValueBars(Collection<Series<Number, Number>> collection) {
		Group bars = new Group();
		int z = 0;
		for (XYChart.Series<Number, Number> series : collection) {
			// TODO use the name in legend
			String zName = series.getName();
			for (Data<Number, Number> data : series.getData()) {
				double x = data.XValueProperty().get().doubleValue();
				double val = data.YValueProperty().get().doubleValue();

				addValueBar(bars, x, z, val);
			}
			z++;
		}
		return bars;
	}

	private void addValueBar(Group bars, double x, int z, double val) {
		Color color = barColors[z];
		bars.getChildren().add(createBar(new Point3D(x * xBarSeparation, 0, -z * zBarSeparation), val, color));
	}

	private static Box createBar(Point3D pos, double height, Color color) {
		Box box = new Box(barWidth, height, barDepth);
		final PhongMaterial material = new PhongMaterial();
		material.setDiffuseColor(color);
		material.setSpecularColor(color.brighter());
		box.setMaterial(material);

//		bar.getStyleClass().addAll("chart-bar", "series" + seriesIndex, "data" + itemIndex,series.defaultColorStyleClass); From class BarChart

		box.setTranslateX(pos.getX());
		box.setTranslateY(pos.getY() - height / 2);
		box.setTranslateZ(pos.getZ());
		Tooltip.install(box, new Tooltip("x = " + pos.getX() + ", height = " + height + ", z = " + -pos.getZ()));
		return box;
	}

	private static void mouseHandler(Group sceneRoot, MouseEvent event) {
		if (event.getEventType() == MouseEvent.MOUSE_PRESSED || event.getEventType() == MouseEvent.MOUSE_DRAGGED) {
			mousePressedOrMoved(sceneRoot, event);
		}
	}

	private static void mousePressedOrMoved(Group sceneRoot, MouseEvent event) {
		Rotate xRotate = new Rotate(0, 0, 0, 0, Rotate.X_AXIS);
		Rotate yRotate = new Rotate(0, 0, 0, 0, Rotate.Y_AXIS);
		sceneRoot.getTransforms().addAll(xRotate, yRotate);
		double mouseXnew = event.getSceneX();
		double mouseYnew = event.getSceneY();
		if (event.getEventType() == MouseEvent.MOUSE_DRAGGED) {
			double pitchRotate = xRotate.getAngle() + (mouseYnew - mouseYold) / rotateModifier;
			xRotate.setAngle(pitchRotate);
			double yawRotate = yRotate.getAngle() - (mouseXnew - mouseXold) / rotateModifier;
			yRotate.setAngle(yawRotate);
		}
		mouseXold = mouseXnew;
		mouseYold = mouseYnew;
	}

	public static void addMouseWheelControl(Scene scene, Group group) {
		scene.setOnScroll(event -> {
			if (event.isShiftDown()) {
				group.setTranslateX(group.getTranslateX() + event.getDeltaX());
			} else {
				if (event.isControlDown()) {
					group.setTranslateZ(group.getTranslateZ() - event.getDeltaY());
				} else {
					group.setTranslateY(group.getTranslateY() + event.getDeltaY());
				}
			}
		});

	}

	private static Camera createCamera() {
		Camera camera = new PerspectiveCamera(true);
		camera.setNearClip(0.1);
		camera.setFarClip(10000.0);
		camera.setTranslateX(400);
		camera.setTranslateY(-200);
		camera.setRotationAxis(Rotate.X_AXIS);
		camera.setRotate(20);
		camera.setRotationAxis(Rotate.Y_AXIS);
		camera.setRotate(-20);
		camera.setTranslateZ(-1200);

		return camera;
	}

}
And here's a class which is currently solely used by BarChart3D.
package com.i2brain.chart3d;

import static java.lang.Math.sqrt;
import javafx.geometry.Point3D;
import javafx.scene.Group;
import javafx.scene.Node;
import javafx.scene.control.Label;
import javafx.scene.layout.Pane;
import javafx.scene.paint.Color;
import javafx.scene.paint.PhongMaterial;
import javafx.scene.shape.Box;
import javafx.scene.shape.Rectangle;

import com.i2brain.fx3d.LineFactory;

public class Axes {
	final int barWidth = 2;

	/** The length of the axes (number of pixels). TODO make these into properties. They are
	 * temporarily public to allow users to change them. Cludge!*/
	public int maxX = 500, maxY = 500, maxZ = 500;

	final PhongMaterial axisMaterial = new PhongMaterial();

	/** Gap between the lines on the plane created by 2 axes. */
	private int lineSpacing = 100;
	private LineFactory lineFactory = new LineFactory();

	Node createAxes(String xLabel, String yLabel, String zLabel) {
		Group axes = new Group();
		axisMaterial.setDiffuseColor(Color.BLACK);
		axisMaterial.setSpecularColor(Color.BLACK.brighter());

		axes.getChildren().addAll(createXAxis(xLabel), createYAxis(yLabel), createZAxis(zLabel), createXYPlane(), createYZPlane(), createXZPlane());

		return axes;
	}

	private Node createXYPlane() {
		Group group = new Group();
		for (int x = 0; x <= maxX; x += lineSpacing) {
			group.getChildren().add(createLine(new Point3D(x, 0, 0), new Point3D(x, -maxY, 0)));
		}
		for (int y = 0; y <= maxY; y += lineSpacing) {
			group.getChildren().add(createLine(new Point3D(0, -y, 0), new Point3D(maxX, -y, 0)));
		}

//		group.getChildren().add(makeAxesPlane(maxX, maxY, 2, Color.LIGHTYELLOW, maxX / 2, -maxY / 2, barWidth*2));

		return group;
	}

	private static Box makeAxesPlane(int maxX, int maxY, int maxZ, Color col, double xTrans, double yTrans, double zTrans) {
		Box plane = new Box(maxX, maxY, maxZ);
		plane.setTranslateX(xTrans);
		plane.setTranslateY(yTrans);
		plane.setTranslateZ(zTrans);
		plane.setMaterial(new PhongMaterial(col));
		// TODO use transparency in 8u60: https://stackoverflow.com/questions/29308397/javafx-3d-transparency
		return plane;
	}

	private Node createYZPlane() {
		Group group = new Group();
		for (int z = 0; z <= maxZ; z += lineSpacing) {
			group.getChildren().add(createLine(new Point3D(0, 0, -z), new Point3D(0, -maxY, -z)));
		}
		for (int y = 0; y <= maxY; y += lineSpacing) {
			group.getChildren().add(createLine(new Point3D(0, -y, 0), new Point3D(0, -y, -maxZ)));
		}
//		group.getChildren().add(makeAxesPlane(2, maxY, maxZ, Color.ORANGE, -barWidth*2, -maxY / 2, -maxZ / 2));
		return group;
	}

	private Node createXZPlane() {
		Group group = new Group();
		for (int z = 0; z <= maxZ; z += lineSpacing) {
			group.getChildren().add(createLine(new Point3D(0, 0, -z), new Point3D(maxX, 0, -z)));
		}
		for (int x = 0; x <= maxX; x += lineSpacing) {
			group.getChildren().add(createLine(new Point3D(x, 0, 0), new Point3D(x, 0, -maxZ)));
		}
//		group.getChildren().add(makeAxesPlane(maxX, 2, maxZ, Color.LIGHTBLUE, maxX / 2, barWidth*2, -maxZ / 2));
		return group;
	}

	private Node createLine(Point3D origin, Point3D target) {
		return lineFactory.createLine(origin, target);
	}

	/** TODO Ideally, we could expect the Chart3D to be based on the CSS for 2D Charts...
	 * @param label
	 */
	@SuppressWarnings({ "rawtypes", "unchecked" })
	private static void setStyle(Node label) {
//		label.getStyleClass().add("axis-label");	// TODO get it working: https://docs.oracle.com/javase/8/javafx/user-interface-tutorial/css-styles.htm#CIHGIAGE
//		List styleList = BarChart.getClassCssMetaData();
//		for (Object style : styleList) {
//			CssMetaData data = (CssMetaData)style;
//			System.out.println(data);
//		}
//		for (String style : new BarChart(new CategoryAxis(), new NumberAxis()).getStyleClass()) {	// chart, bar-chart
//		for (String style : new CategoryAxis().getStyleClass()) {	// axis
//			System.out.println(style);
//		}
//		String textFill = Label.getClassCssMetaData();
//		getStyle("-fx-text-fill: aqua;");
	}

	private Group createXAxis(String xLabel) {
		Group group = new Group();
		Box xAxis = new Box(maxX, barWidth, barWidth);
		xAxis.setMaterial(axisMaterial);
		xAxis.setTranslateX(maxX / 2);
		Label label = new Label(xLabel);
		label.setTranslateX(maxX / 2);
		label.setTranslateY(0);
		setStyle(label);
		label.setStyle("-fx-text-fill: aqua;");
		group.getChildren().addAll(xAxis, label, createTicksOnXAxis());
		return group;
	}

	/** TODO Very rough. Needs list of Texts, really. */
	private Node createTicksOnXAxis() {
		Group group = new Group();
		int x = 0;
		int cntTicks = 5;
		int deltaX = maxX / cntTicks ;
		// TODO breaks when deltaX < 1!
		for (int i = 0 ; i <= cntTicks ; i++) {
			Label label = new Label(String.valueOf(x));
			label.setTranslateX(x - 10); // guessed	// should be deltaX - length / 2 !
			label.setTranslateY(15); // guessed	// should be deltaX - length / 2 !
			group.getChildren().addAll(label, lineFactory.createLine(new Point3D(x, 0, 0), new Point3D(x, 10, 0)));
			System.out.println(label.getBoundsInParent());	// I need the width!
			x += deltaX;
		}
		return group;
	}

	private Group createYAxis(String yLabel) {
		Group group = new Group();
		Box yAxis = new Box(barWidth, maxY, barWidth);
		yAxis.setMaterial(axisMaterial);
		yAxis.setTranslateY(-maxY / 2);
		Label label = new Label(yLabel);
//		System.out.println("Width = " + label.getWidth());	// 0!
		label.setTranslateX(-50);	// Guessed! TODO how to do it properly?
		label.setTranslateY(-maxY / 2);

		label.setStyle("-fx-text-fill: aqua;");
		group.getChildren().addAll(yAxis, label, createTicksOnYAxis());
		return group;
	}

	private Node createTicksOnYAxis() {
		Group group = new Group();
		int y = 0;
		int cntTicks = 5;
		int deltaY = maxY / cntTicks ;
		// TODO breaks when deltaY < 1!
		for (int i = 0 ; i <= cntTicks ; i++) {
			Label label = new Label(String.valueOf(y));
			label.setTranslateX(-40); // guessed
			label.setTranslateY(-y - 10); // guessed
			group.getChildren().addAll(label, lineFactory.createLine(new Point3D(0, -y, 0), new Point3D(-10, -y, 0)));
			y += deltaY;
		}
		return group;
	}

	private Group createZAxis(String zLabel) {
		Group group = new Group();
		Box zAxis = new Box(barWidth, barWidth, maxZ);
		zAxis.setMaterial(axisMaterial);
		zAxis.setTranslateZ(-maxZ / 2);
		Label label = new Label(zLabel);
		label.setTranslateX(-50);	// Guessed! TODO how to do it properly?
		label.setTranslateZ(-maxZ / 2);
		label.setStyle("-fx-text-fill: aqua;");
		group.getChildren().addAll(zAxis, label, createTicksOnZAxis());
		return group;
	}

	private Node createTicksOnZAxis() {
		Group group = new Group();
		int z = 0;
		int cntTicks = 5;
		int deltaZ = maxZ / cntTicks ;
		// TODO breaks when deltaZ < 1!
		for (int i = 0 ; i <= cntTicks ; i++) {
			Label label = new Label(String.valueOf(z));
			label.setTranslateX(-40); // guessed
			label.setTranslateZ(-z - 10); // guessed
			group.getChildren().addAll(label, lineFactory.createLine(new Point3D(0, 0, -z), new Point3D(-10, 0, -z)));
			z += deltaZ;
		}
		return group;
	}
}
This last file is the first which presented itself as a useful utility class. (So it's in a separate package.)
It creates a line between the coordinates which are passed to the method createLine(Point3D origin,
Point3D target).
package com.i2brain.fx3d;

import javafx.geometry.Point3D;
import javafx.scene.Node;
import javafx.scene.paint.Color;
import javafx.scene.paint.PhongMaterial;
import javafx.scene.shape.Box;
import javafx.scene.transform.Rotate;
import javafx.scene.transform.Translate;

/** Creates a line between the coordinates which are passed to the method createLine.
*/
public class LineFactory {

	/** The material for the lines parallel to the axes. */
	private PhongMaterial lineMaterial = new PhongMaterial();

	/** Sets a default grey material for the line.
	 */
	public LineFactory() {
		lineMaterial.setDiffuseColor(Color.GREY);
		lineMaterial.setSpecularColor(Color.GREY.brighter());
	}

	/** The caller may change the material. */
	public void setMaterial(PhongMaterial lineMaterial) {
		this.lineMaterial = lineMaterial;
	}

	/** Based on https://netzwerg.ch/blog/2015/03/22/javafx-3d-line/
	 */
	public Node createLine(Point3D origin, Point3D target) {
	    Point3D yAxis = new Point3D(0, 1, 0);
	    Point3D diff = target.subtract(origin);
	    double height = diff.magnitude();

	    Point3D mid = target.midpoint(origin);
	    Translate moveToMidpoint = new Translate(mid.getX(), mid.getY(), mid.getZ());

	    Point3D axisOfRotation = diff.crossProduct(yAxis);
	    double angle = Math.acos(diff.normalize().dotProduct(yAxis));
	    Rotate rotateAroundCenter = new Rotate(-Math.toDegrees(angle), axisOfRotation);

	    Box line = new Box(1, height, 1);
	    line.setMaterial(lineMaterial);

	    line.getTransforms().addAll(moveToMidpoint, rotateAroundCenter);

	    return line;
	}


}